How do you define the success of an API? Is it the number of developers using the API, the number of apps built using the API, the revenue stream it has created, or perhaps some other KPI? Whatever the criteria, the important bit is to constantly generate demand among the target audience, and keep measuring and aligning their activities towards the desired success criteria.
Knowing your Audience
Defining an ideal customer profile is the first step of any demand generation strategy. Imagine after publishing a well-crafted API, you want to go out and start marketing it, but do you actually know what your ideal consumer/developer profile is? Do you want to target consumers of mobile or web or both? What developer community and platforms are important to you?
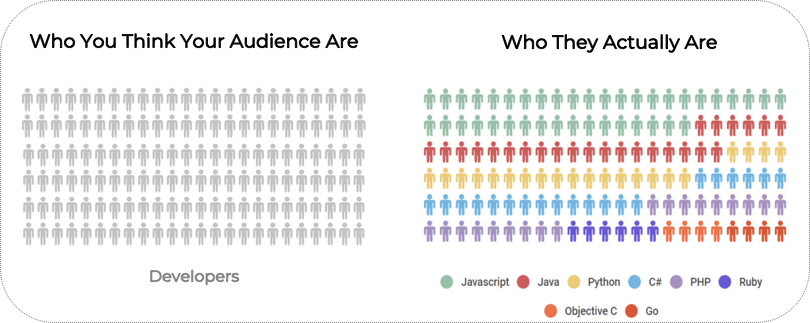
Remember, your API is language-agnostic, but your targeted platforms and developers are not. Therefore, understanding the needs of a large diverse audience is as important as speaking their language. Here is a talk elucidating how Twilio has created a phenomenal API experience by supporting a variety of languages.
How are Developers Interacting with Your API?
After identifying the success criteria for your API, and knowing who your audience is, it’s time to measure how they perform once they have landed on your API portal. For this purpose, we are introducing a novel kind of metrics at APIMatic.io, which we call “Developer Experience Analytics”.

While there exist a bunch of solutions to analyze API traffic, APIMatic’s analytics are focused on the developer experience with respect to developers and programming platforms. For example, it can help in knowing how many users get to make a successful call with your API before they even start coding. Or how many developers are running into problems while trying out an API, and the nature of their problems.
There is a variety of metrics available, such as:
- Time to First API Call (TTFC): shows the average time taken by different users to the first API call with the 2XX status code. Reaching the first successful API call means a developer has figured out the API communication setup and authentication requirements etcetera and is now ready to start integrating the API in production code. The time taken to reach the first call can help measure how intuitive and straightforward your API’s onboarding process is.
- API Portal Visits: represents the traffic on your API portal, but at a more granular level based on the languages/platform documentation visited. The language distribution can help measure the popularity of a particular language or gauge the results of a demand generation effort being made to attract a particular developer community.
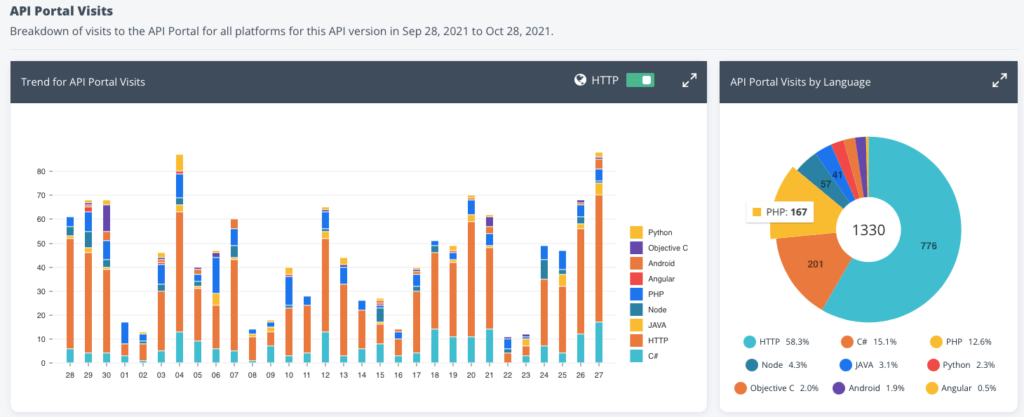
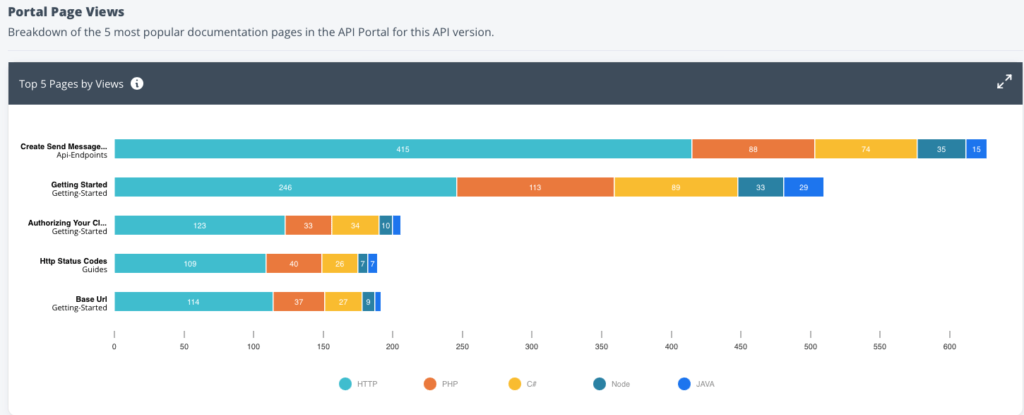
- Portal Page Views: portrays the most popular pages visited by the developers of different languages. This could be a great indicator of the importance of a particular language, endpoint, use case, or a custom guide.
- API Code Playground calls: depicts the actual API calls made by users using their own data, right from the docs. The result of those calls, in terms of returned HTTP status codes, is quite insightful to fix any potential issues in the docs or in the developers’ understanding.
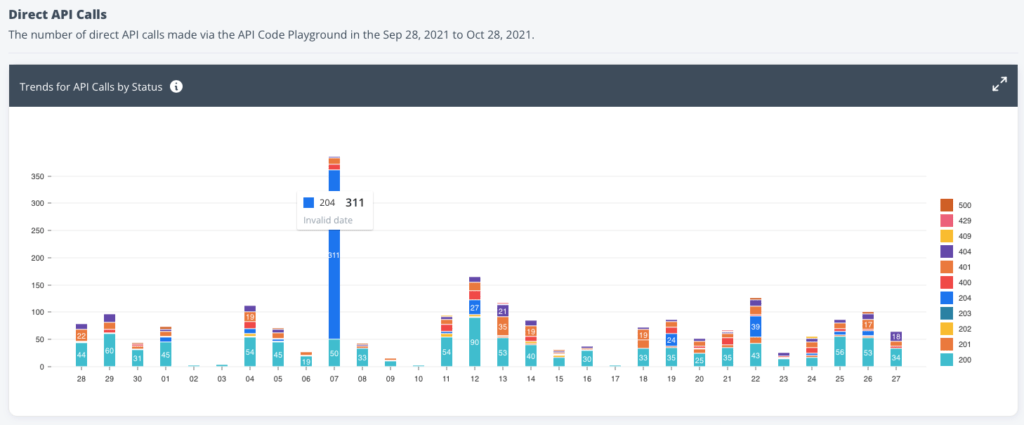
Moreover, the API code playground also generates dynamic code samples, so analyzing the calls with respect to languages would also help identify the efforts and struggles of the developers of different languages.

For further details and a complete list of available metrics, please visit our detailed documentation on the Developer Experience Analytics. We aim to add more metrics in the future, including a few from the SDKs usage on the client-side. Please feel free to reach out for any feedback and suggestions.


